Housing & Economic Signals
What Is a Cap Rate in Real Estate? Formula, Examples, and Market Meaning
A cap rate divides a property's net operating income by its value or price. This guide explains the formula with worked examples, how to calculate NOI, why there is no universal "good" cap rate, and what 2026 CBRE research says about cap-rate conditions.
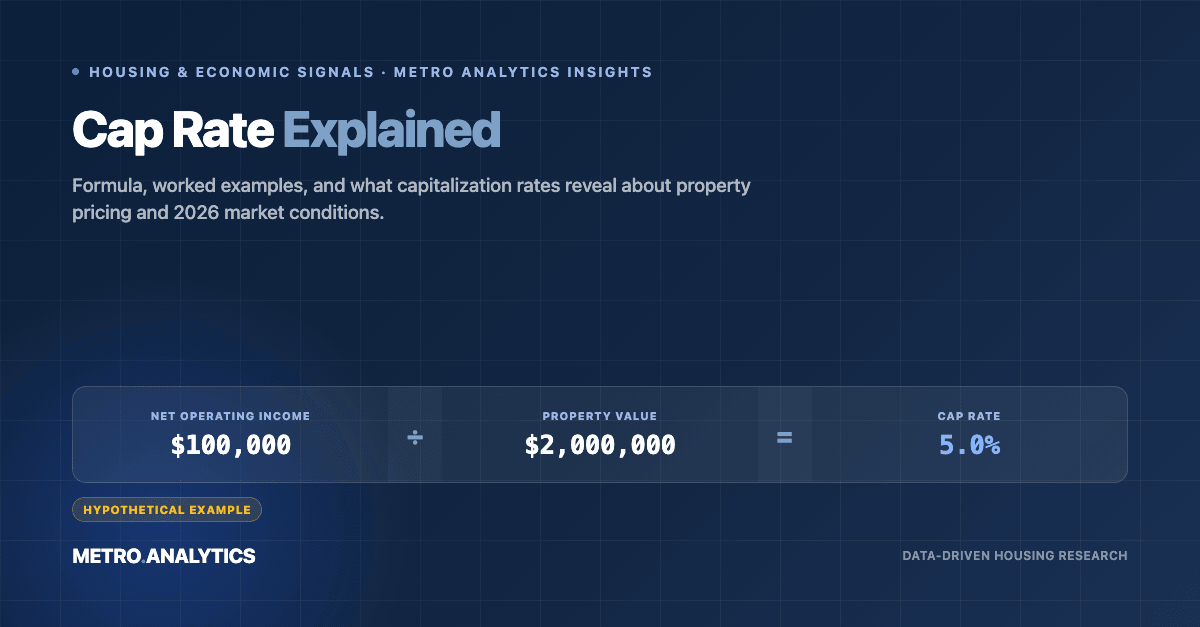
Cap rate formula · worked example
$100,000 NOI ÷ $2,000,000 property value
Illustrative arithmetic, not a market average or forecast. 2026 CBRE research below describes professional estimates and expectations.
A cap rate, short for capitalization rate, is a property's annual net operating income (NOI) divided by its market value or purchase price, expressed as a percentage. It shows the unlevered income yield a property produces relative to its price, before any mortgage payments. Nareit describes it as a key pricing metric in real estate investment.
Cap Rate (%) = Annual Net Operating Income ÷ Property Value × 100
A property with $100,000 of annual NOI valued at $2,000,000 has a 5% cap rate.
The formula is simple. Reading it well is not. A cap rate depends on which income figure is used, which value or price sits in the denominator, and what kind of property and market it describes. It is not a mortgage rate, not a return on the investor's cash, and not a forecast of what a property will earn.
Hypothetical
The Cap-Rate Formula and a Worked Example
The formula can be rearranged to solve for any of its three parts:
Rearranging the formula
| To find | Use |
|---|---|
| Cap rate | NOI ÷ Value |
| Indicated value | NOI ÷ Cap rate |
| NOI implied by a price and cap rate | Value × Cap rate |
Swipe horizontally to view all columns →
Source: Nareit, capitalization-rate glossary.
Which value goes in the denominator?
Nareit notes that the denominator can be either a property's current market value or its purchase price. The choice matters:
- Purchase price gives the yield a buyer is paying for at acquisition. It is the basis for a going-in cap rate.
- Current market value shows the yield on what the property is worth today, which can be very different from what an owner paid years ago.
An owner who bought cheaply long ago may see a high cap rate on cost and a much lower one on current value. The two numbers answer different questions, so a cap rate should always be reported with its basis.
Worked example (hypothetical)
- Gross rental and other operating income: $180,000
- Less vacancy and credit loss: −$9,000
- Effective gross income: $171,000
- Less operating expenses (taxes, insurance, maintenance, management, utilities): −$71,000
- Net operating income: $100,000
- Property value: $2,000,000
- Cap rate: $100,000 ÷ $2,000,000 = 5.0%
Hypothetical
Sensitivity: same NOI, different cap rates
Because value equals NOI divided by the cap rate, small changes in the cap rate produce large changes in indicated value. Holding NOI at $100,000:
Hypothetical arithmetic, not market pricing — NOI fixed at $100,000
These figures are hypothetical arithmetic. They are not Metro Analytics data, market pricing, an appraisal, or an expected return.
How to Calculate Net Operating Income
NOI is the property's income from operations after normal operating expenses and before financing. In outline:
NOI = Rental and other operating income − vacancy and credit loss − operating expenses
Flows into NOI
Excluded from NOI
NOI is not cash flow after financing
NOI stops before debt service. Cash flow to an owner who borrowed is NOI minus mortgage payments (and any capital spending). Net income on a tax return also differs, because it reflects depreciation, interest and taxes. And an investor's equity return depends on how much cash was invested, how much was borrowed, and the property's eventual sale. A cap rate built on NOI describes none of these directly.
Capital expenditures and reserves
Capital spending, such as a new roof or HVAC system, is the gray area. Practice varies: some analysts deduct an annual replacement reserve before NOI, others show it below NOI, and some marketing materials leave it out entirely. The correct treatment follows the convention used for that NOI and appraisal — there is no single universal rule, and a before-reserves NOI is not inherently invalid, provided it is labeled and compared on a consistent basis. Two properties with the same "NOI" can therefore differ by how they treat capital needs, and a cap rate on NOI without reserves can look higher than one with them. When comparing cap rates, check whether reserves were deducted, keep the NOI and the cap rate applied to it on the same basis, and check that expenses reflect realistic, current operating costs rather than unusually low ones.
Trailing, Forward and Stabilized NOI
The same property can carry several cap rates, depending on which NOI is used. Nareit notes that a cap rate may be calculated on either trailing NOI (the prior 12 months) or forward NOI (the next 12 months), and that forward NOI is more common when pricing acquisitions.
Trailing, forward and stabilized NOI
| NOI basis | What it measures | Watch for |
|---|---|---|
| Trailing (T-12) | Actual results over the past 12 months | May include one-off items or a vacancy that has since been filled |
| Forward (Year 1 pro forma) | Projected NOI for the next 12 months | Depends on the assumptions behind the projection |
| Stabilized | NOI once a property reaches normal occupancy and operations | May describe a future state the property has not yet reached |
Swipe horizontally to view all columns →
Source: Nareit, capitalization-rate glossary; CBRE H1 2026 U.S. Cap Rate Survey.
A seller presenting forward or stabilized NOI can show a higher cap rate than the trailing figures support, and a buyer underwriting on trailing NOI may see a lower one. Neither is wrong, but they are not comparable. Nareit also notes that cap rates generally assume stabilized income and expenses, which can understate value-add upside or near-term leasing risk.
CBRE's H1 2026 U.S. Cap Rate Survey shows why the basis matters. Its stabilized cap rates divide stabilized NOI by the acquisition price. Its value-add cap rates divide the NOI expected after property improvements by the acquisition price plus the value-add capital. Those are different calculations, and their results should not be compared as if they were the same.
What Is a Good Cap Rate?
There is no single "good" cap rate. A cap rate is a price signal, and what it signals depends on the property, the market and the income behind it.
In general, a lower cap rate means buyers are paying more for each dollar of current income. That can reflect expectations of stable income, strong locations, high-quality assets or future income growth. A higher cap rate means buyers pay less for each dollar of current income. That can reflect older or weaker assets, less certain income, tenant risk, or markets where buyers expect slower growth.
- Strong, stable income and tenants
- Newer or better-located property
- Expected rent or income growth
- Deep buyer demand and liquidity
- Less certain income or tenant risk
- Older property or deferred maintenance
- Lower expected growth
- Thinner buyer pool or harder financing
Neither is automatically better.
Neither column is automatically better:
- A higher cap rate is not a guarantee of better returns. More current income per dollar may come with more risk, more capital needs or weaker growth.
- A lower cap rate is not automatically safer. A low going-in yield leaves less cushion if income disappoints or if cap rates rise later.
The useful question is not "is this cap rate high or low?" but "is this cap rate reasonable for this property's income, risk and market, compared with similar properties measured the same way?"
Why Cap Rates Differ Across Properties and Markets
Nareit cautions that cap rates are not fully comparable across property types and geographies, because risk, growth expectations and market conditions differ. The main sources of difference:
- Property type. Multifamily, industrial, retail, office and hotel properties have different lease structures, income volatility and capital needs. A hotel's income can change nightly; a long-leased industrial building's income may be contracted for years.
- Asset quality and class. Class A, B and C properties differ in age, condition and tenant base. CBRE reports class A and stabilized assets separately from class B, class C and value-add assets.
- Geography. Local job growth, population trends, supply and regulation shape both income risk and buyer demand. CBRE defines its survey markets by Census Bureau metro areas and reports results across more than 50 of them.
- Lease terms and tenants. Long leases with strong tenants usually support lower cap rates than short leases or weaker credit.
- Capital-market conditions. Interest rates and investor appetite affect what buyers will pay for a given income stream.
The practical rule: compare like with like. A stabilized multifamily cap rate should not be set beside an office, hotel or value-add cap rate as if they measured the same thing. Comparisons need consistent property type, quality, NOI basis, period and geography.
Cap-Rate Compression and Expansion Explained
- Compression means cap rates are falling: buyers pay more for the same income, so values rise if NOI holds steady.
- Expansion means cap rates are rising: buyers pay less for the same income, so values fall if NOI holds steady.
Using the hypothetical property from earlier, with NOI fixed at $100,000:
Hypothetical; NOI held constant at $100,000
Compression
4.5%
$2,222,222
−0.5 point
Starting point
5.0%
$2,000,000
baseline
Expansion
5.5%
$1,818,182
+0.5 point
What moves cap rates
Cap rates respond to the cost and availability of capital as well as to property fundamentals. When interest rates rise, buyers relying on debt face higher borrowing costs, and investors can earn more on alternatives such as Treasury bonds, which can put upward pressure on cap rates. Changes in expected rent growth, vacancy, operating costs and perceived risk also matter.
In practice, NOI and cap rates often move together, so value changes are rarely as clean as the table suggests.
What expansion does and does not mean
Cap-rate expansion means pricing has adjusted relative to income. It does not, by itself, predict a market crash or a fall in rents. Likewise, compression is not proof of strong fundamentals; it can reflect lower interest rates or more aggressive buyers.
What 2026 Research Reveals About Cap-Rate Conditions
The examples below are dated snapshots from CBRE research. They show how professionals read the market at specific points in 2026; they are not current pricing for any property.
H1 2026 U.S. Cap Rate Survey
about 3,600 cap-rate estimates across more than 50 markets, from more than 200 professionals.
A More Guarded Outlook for Cap Rates
No change 53%→63%; compression 42%→20%; expansion 17% in H1 2026.
Higher-for-Longer Rates
about 160 bps spread vs. about 325 bps long-run; CBRE forecasts a 40–60 bps rise.
Estimates and expectations, not realized transactions.
CBRE's H1 2026 U.S. Cap Rate Survey (published August 12, 2026)
How it works. The survey compiles about 3,600 cap-rate estimates across more than 50 U.S. markets, defined by Census Bureau metro areas. More than 200 CBRE real estate professionals completed it in late June 2026. Their estimates reflect recent trades in their markets and conversations with investors. They are professional estimates, not a database of 3,600 completed transactions.
What it found:
- The all-property average cap rate was essentially flat over the half-year.
- The eastern U.S. saw more compression than other regions.
- Class B, class C and value-add assets compressed more than class A and stabilized assets.
- Among property types, neighborhood retail compressed the most, followed by hotel and industrial.
- Office estimates were mixed, with a wider spread between lower and upper estimates.
- Infill multifamily was the subtype where respondents most often expected cap rates to rise.
Context. CBRE tied the survey period to volatile long-term interest rates, citing higher inflation expectations, a larger term premium and shifting expectations for Fed policy, and noted that respondents said geopolitical events had reduced their expectations for investment activity. The median respondent said the 10-year Treasury yield would need to fall to 3.75% to trigger a notable increase in sales volume. CBRE also cautioned that fast-changing conditions might not be fully reflected in the results.
Sentiment shifted between surveys (CBRE brief, August 26, 2026)
CBRE Econometric Advisors compared respondents' six-month expectations across the two most recent surveys:
Expected cap-rate direction, next six months
| Direction | H2 2025 survey | H1 2026 survey |
|---|---|---|
| No change | 53% | 63% |
| Compression (decline) | 42% | 20% |
| Expansion (rise) | not stated | 17% |
Swipe horizontally to view all columns →
Source: CBRE Econometric Advisors, "A More Guarded Outlook for Cap Rates," August 26, 2026, Figure 1. Survey expectations, not realized cap rates.
Source: CBRE Econometric Advisors, "A More Guarded Outlook for Cap Rates," August 26, 2026, Figure 1. These are survey expectations, not realized cap rates.
The shift toward expected expansion was most notable in multifamily, and more respondents expected higher cap rates for class C assets.
A later CBRE view (October 28, 2026)
In a brief on higher-for-longer interest rates, CBRE estimated that the average spread between cap rates and the 10-year Treasury yield was about 160 basis points, a record low by its measure, compared with a long-run average of roughly 325 basis points. It said multifamily and industrial spreads were below 100 basis points. CBRE forecast that cap rates would rise by at least 40 to 60 basis points over the near term, while noting risks to that forecast. That is CBRE's projection, not an observed outcome.
How to read this research
- Estimates, expectations and forecasts are different things, and none of them is a realized transaction cap rate.
- Methodologies differ. Survey estimates, spread calculations and transaction-based measures should not be blended into one number.
- Interest rates matter but are not the whole story. Long-term yields influence what buyers will pay, but property income, supply and local demand matter too. See how mortgage rates are determined.
Going-In vs. Exit Cap Rates
- Going-in cap rate: the acquisition yield, usually Year 1 or stabilized NOI divided by the purchase price. It is either observed at the time of purchase or assumed in underwriting.
- Exit (terminal) cap rate: an assumption about the cap rate at which a property will be sold in the future, used to estimate a sale price in an investment model.
The exit cap rate is an assumption, not a known outcome. A projected sale price built on it depends on two uncertain inputs: the NOI in the sale year and the cap rate buyers will accept at that time.
Because value is so sensitive to the cap rate, the exit assumption can drive much of a projected return. Analysts often test several exit cap rates. Many models also assume an exit cap rate at or above the going-in rate, to avoid relying on future compression. That is a modeling convention, not a rule, and the right assumption depends on the property and market.
Cap Rate vs. Mortgage Rate, Cash-on-Cash Return and Other Metrics
Nareit notes that a cap rate does not account for financing, capital structure or property-specific factors. That is what separates it from the other numbers investors use.
Cap rate
NOI ÷ value or price: the unlevered income yield on the property
Mortgage interest rate
The interest charged on a loan
Cash-on-cash return
Annual pre-tax cash flow after debt service ÷ cash invested
Internal rate of return (IRR)
The return across the full holding period, including the projected sale
Includes financing?
Cap rate is not the mortgage rate
A cap rate is a property's income yield; a mortgage rate is what a lender charges a borrower. Higher borrowing costs can affect what buyers will pay, but a cap rate does not tell you what any buyer's loan costs, and two buyers with different financing see the same cap rate.
Cap rate vs. cash-on-cash return
Wall Street Prep describes the cap rate as an unlevered metric and cash-on-cash yield as a levered one: cash flow after debt service divided by the equity contributed.
A hypothetical illustration: on the $2,000,000 property with $100,000 of NOI, a buyer who pays all cash earns a 5% operating-income yield before capital spending and other relevant cash costs. That 5% is not a guaranteed cash return to the investor; it depends on the stated assumptions holding, and it excludes items such as capital expenditures, closing costs and reserves. A buyer who borrows will see a different cash-on-cash return, higher or lower, depending on the loan amount, rate and terms. If annual debt service is large relative to NOI, cash-on-cash return can fall below the cap rate, or turn negative. The cap rate is the same in every case.
Common Cap-Rate Mistakes
- Mixing NOI bases. Comparing a cap rate built on trailing NOI with one built on forward or stabilized NOI.
- Leaving costs out of NOI. Understated expenses, missing management fees or no replacement reserves inflate NOI and the cap rate.
- Subtracting debt service. Mortgage payments do not belong in NOI; deducting them confuses a property yield with an equity return.
- Ignoring the denominator. Not saying whether the cap rate is on purchase price, current value or total cost including improvements.
- Comparing unlike properties. Setting a stabilized multifamily cap rate beside an office, hotel or value-add cap rate as if they were equivalent.
- Treating survey estimates as sales. Survey cap rates are professional estimates, not completed transactions.
- Using a cap rate as a valuation by itself. A cap rate is one input into value. An appraisal or full analysis also considers comparable sales, lease terms, condition, capital needs and market evidence.
How Market Indicators Can Support Property-Level Research
A cap rate is a property-level number, but the income and risk behind it are shaped by the local market. Metro-level indicators cannot produce a cap rate for a property, but they can help an analyst judge whether the NOI assumptions and cap-rate comparisons behind a deal make sense.
Household income
Whether local rents are supportable relative to incomes. See median household income by metro area
Rental vacancy
How realistic a vacancy allowance is. See rental vacancy rate
Housing supply and inventory
Whether new supply could pressure rents or occupancy. See housing inventory
Affordability and financing conditions
How prices, incomes and rates interact for buyers and renters. See housing affordability
Population and migration
Longer-run demand for housing in the area.
Local market comparisons
How one metro's conditions compare with others. See metro market data
These indicators provide context, not a valuation. They are a starting point for separate property-level due diligence on leases, expenses, condition, comparable sales and financing. Metro Analytics does not calculate property-specific cap rates, valuations or investment returns. See Metro Analytics for investors and the Methodology.
The Takeaway
- A cap rate is NOI divided by value or price. It is an unlevered income yield, so always state which NOI and which denominator were used.
- NOI is not cash flow. It excludes debt service, depreciation and income taxes, and its treatment of capital reserves varies.
- There is no universal "good" cap rate. Higher is not automatically better, and lower is not automatically safer; property type, quality, location and growth expectations all matter.
- Small cap-rate changes move values a lot. In the hypothetical example, a 0.5-point change shifts indicated value by roughly 9% to 11%.
- 2026 research is a dated snapshot. CBRE's survey estimates and forecasts describe professional views at specific points in 2026, not realized transaction cap rates.
Used with consistent inputs and alongside market evidence, a cap rate is a fast way to compare pricing. On its own, it is not a valuation, a return or a forecast.
Sources
- Nareit — Capitalization Rate (glossary)
- CBRE — U.S. Cap Rate Survey H1 2026
- CBRE Econometric Advisors — A More Guarded Outlook for Cap Rates
- CBRE — Higher-for-Longer Rates: Implications for Commercial Real Estate
- Wall Street Prep — Cap Rate Primer
- Metro Analytics — Methodology
Editorial analysis for informational purposes only. Not investment, legal, or financial advice.