Sales & Prices
New Home Sales Explained: What the Census Report Actually Measures
The Census new home sales report is often read as a count of homes sold, but its headline is a seasonally adjusted annual rate built on contracts, not closings. This guide explains when Census records a sale, what SAAR means, why monthly changes are often not statistically significant, and how new-home sales differ from pending sales, existing-home sales and housing starts.
New single-family home sales · September 2026
676K SAAR
A pace, not a count of homes sold in September.
Source: U.S. Census Bureau / HUD — October 27, 2026
The Census Bureau and HUD reported that new single-family home sales in September 2026 were running at a seasonally adjusted annual rate of 676,000. That does not mean 676,000 newly built houses sold during September.
The 676,000 is a pace, not a monthly count. It is September's seasonally adjusted sales estimate expressed at an annual rate. The Census Bureau describes that rate as the seasonally adjusted monthly value multiplied by 12, and states that it is neither a forecast nor a projection.
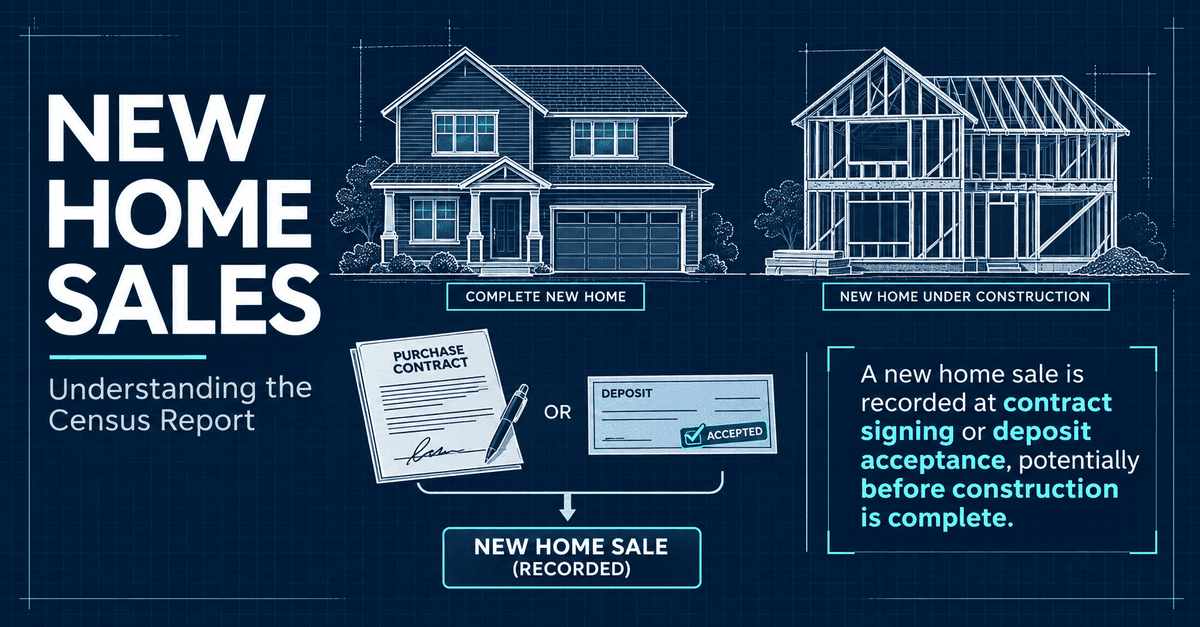
The headline also rests on a specific definition of a "sale." Census counts a new home as sold when a sales contract is signed or a deposit is accepted, which can happen before construction begins and well before closing. And because the figure comes from a sample survey, the monthly change behind the headline can be too uncertain to tell whether sales actually rose or fell.
This guide explains how to read the new home sales report: what it covers, when a home counts as sold, what the seasonally adjusted annual rate (SAAR) means, how uncertain and revisable the monthly estimates are, and how the series differs from pending home sales, existing-home sales and housing starts. It does not forecast sales, prices or rates, and it does not say whether the housing market is "good" or "bad."
What Are New Home Sales?
"New home sales" is the common name for the New Residential Sales series, published monthly by the U.S. Census Bureau and the U.S. Department of Housing and Urban Development (HUD). The estimates come from the Census Bureau's Survey of Construction, a sample survey of newly built housing.
The series measures sales of new single-family homes built for sale. Census's single-family universe includes detached homes and qualifying attached homes such as semidetached homes, row houses and townhouses, provided they meet Census's single-family structural definition. That is a narrower universe than "all new housing," and the boundaries matter when you read the headline.
What is excluded
The New Residential Sales series leaves out:
- sales of multifamily units
- houses built for rent
- houses built by the owner
- houses built by a general contractor on the owner's land
To be included, the sales transaction must intend to include both the house and the land. In Census terms, a built-for-sale house is one where the builder offers the house and the developed lot together as one transaction.
A house built for rent, or one built by a contractor on land the buyer already owns, can count as a housing start but never as a new-home sale. The report measures one segment of new construction, not all newly built homes changing hands.
When Does a New Home Count as Sold?
This is the most important definition in the report. Census states that a house is considered sold when either a sales contract has been signed or a deposit has been accepted.
That means a new home can be recorded as sold:
- before construction begins, while the house exists only as a plan or a model home;
- while it is under construction; or
- after it is completed.
Census also notes that a home can be sold before a building permit has been issued, and its estimates include an allowance for those sales.
Census does not wait for closing
The survey records the sale at the contract or deposit stage and does not follow the transaction through to closing. Census states that it does not adjust the new-home sales figures for cancelled contracts, and that once a sale is reported, the survey does not check back in later months to see whether the sale went through. A contract that later falls apart can therefore remain counted as a sale in the month it was signed. Census also notes that the survey does not capture a later sale of the same house to another buyer: the same housing unit cannot be counted as sold twice.
Census's own explanation is that cancellations can temporarily overstate sales during periods when many contracts are cancelled, but that over the long run they do not cause the series to be systematically over- or underestimated.
Why this matters
A "new-home sale" in this report is a signed deal, not a finished transaction. It is closer to a contract measure than a closing measure, and it can be recorded months before anyone moves in.
Census does not wait for closing.
A sale can be recorded before construction starts, and even before a permit is issued.
What Does 676,000 SAAR Mean?
The headline goes through two steps before it is published.
- Seasonal adjustment. Home sales follow a regular calendar pattern, with more activity in some months than others. Seasonal adjustment removes that typical pattern, so one month can be compared with the next without the calendar doing most of the work.
- Annualization. Census then multiplies the seasonally adjusted monthly value by 12. That converts the month's pace into an annual rate.
Monthly activity → seasonal adjustment → × 12 → 676,000 SAAR
Working the definition backwards, 676,000 ÷ 12 is about 56,300. That is a seasonally adjusted monthly figure derived for this article from Census's definition; it is not the unadjusted number of contracts signed in September, which Census publishes separately and which can be higher or lower depending on the season.
Metro's Housing Starts guide uses the same logic for construction activity: an annualized rate is a way of expressing a monthly pace, not a literal monthly count.
Is
Seasonally adjusted annual sales pace.
Is not
- monthly literal sales count
- next-month prediction
- annual forecast
- guarantee that the pace continues
What the September 2026 Report Shows
The Census Bureau and HUD released the September 2026 New Residential Sales report on October 27, 2026. Its headline figures:
September 2026 report
New Residential Sales headline figures
| Metric | September 2026 | Comparison |
|---|---|---|
| New single-family home sales (SAAR) | 676,000 | 680,000 in August 2026; 714,000 in September 2025 |
| Change from August (point estimate) | -0.6% | 90% confidence interval ±13.8% |
| Change from September 2025 (point estimate) | -5.3% | 90% confidence interval ±12.5% |
| New homes for sale, end of month | 476,000 | Seasonally adjusted |
| Months’ supply at the current sales rate | 8.4 months | — |
| Median sales price | $400,400 | — |
| Average sales price | $472,800 | — |
Swipe horizontally to view all columns →
U.S. Census Bureau and HUD, New Residential Sales, September 2026 (released October 27, 2026). All figures are preliminary and subject to revision.
Source: U.S. Census Bureau and U.S. Department of Housing and Urban Development, New Residential Sales, September 2026 (released October 27, 2026). All figures are preliminary and subject to revision.
Neither the monthly nor the yearly change in sales was statistically significant (see the next section), and every figure in the table is preliminary and subject to revision.
676K
Sales pace (SAAR)
476K
New homes for sale
8.4 months
Months’ supply
$400.4K
Median sales price
U.S. Census Bureau / HUD, New Residential Sales, September 2026. Preliminary estimates.
Why a 0.6% Monthly Decline May Not Actually Be a Decline
The September report shows sales of 676,000 against 680,000 in August, a point estimate of -0.6%. It would be easy to write "new-home sales declined in September." The data do not support that statement on their own.
Point estimate vs. confidence interval
New Residential Sales is built from a sample survey, so each estimate carries sampling error. Census publishes a 90% confidence interval alongside each percentage change. For September's monthly change, that interval was ±13.8 percentage points around the -0.6% estimate, a range of roughly -14.4% to +13.2%.
Zero sits inside that range. Census's rule is direct: if a range contains zero, the change is not statistically significant, and "there is insufficient statistical evidence to conclude that the actual change is different from zero."
The accurate way to describe September is therefore:
Census reported a 0.6% lower point estimate than August, but the 90% confidence interval included zero, so the month-to-month change was not statistically significant.
The same caution applies year over year
The -5.3% change from September 2025 came with a 90% confidence interval of ±12.5 percentage points, a range of roughly -17.8% to +7.2%. That range also includes zero, so the year-over-year change was not statistically significant either.
What "not significant" does and does not mean
- It does not mean sales were definitely unchanged.
- It does not mean the estimate is wrong.
- It does mean the survey does not provide enough evidence to say confidently whether sales rose or fell.
The intervals account only for sampling variability, and Census also cautions that changes in seasonally adjusted statistics often show irregular movement.
Monthly change
Year-over-year change
Not statistically significant
Zero lies inside both 90% confidence intervals, so neither change can be distinguished from zero.
Why One Month of New Home Sales Is Not a Trend
Even a statistically significant monthly change is a single observation. Census's explanatory notes give specific guidance: it takes four months to establish a trend for new houses sold.
The guidance fits the features already covered: sample-based estimates, wide confidence intervals, irregular movement in seasonally adjusted data, and revisions to earlier months. A single month can move sharply and then move back once more reports arrive.
Phrases one month cannot support
A single monthly reading is not enough evidence for statements such as:
- "the housing market is turning"
- "buyers are coming back"
- "demand has collapsed"
- "builders are recovering"
Claims about direction need a pattern across several months of revised data, ideally supported by other indicators.
4 months
Census guidance for establishing a trend in new houses sold
Source: U.S. Census Bureau, New Residential Sales explanatory notes
Why New Home Sales Gets Revised
Every New Residential Sales estimate starts out preliminary. Census states that preliminary new-home sales figures are subject to revision because of the survey's methodology and definitions.
Census points to two features in particular:
- Imputed data are replaced by reported data. When the first estimate is published, some information has not yet been reported and is estimated. Census describes revisions as primarily the result of replacing those imputed figures with data reported in later months.
- Sales before permits. Because a sale can be recorded before a building permit is issued, some sales are not yet visible to the survey when they happen. Census includes an estimate of these earlier sales in the published figure, which is part of why preliminary numbers can change.
How large are the revisions?
Census's explanatory notes state that, on average, the preliminary seasonally adjusted estimate of total sales is revised by about 6.7%. That is a historical average magnitude, not a forecast of how September will be revised: an individual month's revision can be larger or smaller, up or down.
Do not treat the first estimate as permanent. When a new report is released, the prior months' figures can change, and a month-to-month comparison should use the latest revised values. The August 2026 figure of 680,000 cited here is the value shown in the September release, which can differ from the first estimate published for August.
New Home Sales vs. Pending Home Sales vs. Existing-Home Sales
All three are often called "home sales," but they record different events for different homes. The key difference is contract versus closing.
Contract vs. closing
New Home Sales vs. Pending Home Sales vs. Existing-Home Sales
| Feature | New Home Sales | Pending Home Sales | Existing-Home Sales |
|---|---|---|---|
| Publisher | U.S. Census Bureau and HUD | National Association of REALTORS® (NAR) | NAR |
| Homes covered | New single-family homes built for sale | Existing single-family homes, condos and co-ops | Existing single-family homes, condos and co-ops |
| Event recorded | Sales contract signed or deposit accepted | Signed contract | Completed transaction |
| Closing required? | No | No | Yes |
| Headline form | Seasonally adjusted annual rate | Index of contract activity | Seasonally adjusted annual rate |
Swipe horizontally to view all columns →
Sources: U.S. Census Bureau and HUD; National Association of REALTORS®.
NAR describes its Pending Home Sales Index as based on signed contracts for existing homes and says it generally leads existing-home sales by a month or two. Existing-home sales, by contrast, capture completed transactions. Census's own comparison notes that NAR records a sale at closing, and that because mortgage financing typically takes 30 to 60 days, closings usually trail the contracts behind them by a month or two.
Why they are not interchangeable
- Different stage. New-home sales and pending home sales are contracts; existing-home sales are closings, typically recorded a month or two after the contract.
- Different homes. New-home sales cover newly built single-family homes built for sale. NAR's two series cover previously owned homes, including condos and co-ops.
- Different methods. Census and HUD estimate new-home sales from a sample survey; NAR compiles its series separately.
Because the universes do not overlap, the series can move in different directions in the same month without any of them being wrong. Adding new-home and existing-home sales together, or comparing their monthly changes as if they were the same measurement, mixes contracts with closings.
New Home Sales vs. Housing Starts
Housing starts and new-home sales are both Census construction statistics, and both headlines are reported as seasonally adjusted annual rates. They record different events.
Housing start
Physical construction of the house begins.
New-home sale
A sales contract is signed or a deposit is accepted.
Because Census allows a home to be recorded as sold before construction begins, there is no fixed order between the two events. A built-for-sale house can follow any of these sequences:
- Sale → Start → Completion: sold from plans or a model before construction begins.
- Start → Sale → Completion: sold while under construction.
- Start → Completion → Sale: sold after it is finished.
The universes also differ. Starts include every new single-family house, including those built for rent, built by owners and built by contractors on the owner's land. New-home sales include only houses built for sale. So the two series should not be read as a pipeline in which every start later becomes a sale.
Metro's Housing Starts and Building Permits guide explains permits, starts and completions in detail.
Homes Can Sell at Different Construction Stages
The report itself shows that a "new-home sale" does not mean a finished house. Census breaks seasonally adjusted sales down by the stage of construction at the time of sale. For September 2026, the 676,000 annual rate was split as follows:
September 2026 · by stage at time of sale
Sales split by construction stage
| Stage at time of sale | Sales, SAAR | Share of total |
|---|---|---|
| Not yet started | 82,000 | about 12% |
| Under construction | 214,000 | about 32% |
| Completed | 380,000 | about 56% |
Swipe horizontally to view all columns →
Source: U.S. Census Bureau and HUD, New Residential Sales, September 2026. Shares are calculated for this article from the published figures and may not sum to 100% because of rounding.
Source: U.S. Census Bureau and HUD, New Residential Sales, September 2026. Shares are calculated for this article from the published figures and may not sum to 100% because of rounding.
The point is conceptual, not a monthly scorecard: the sale stage is not the construction-completion stage. In September, a substantial portion of the homes counted as sold had not been finished, and some had not been started. For those homes, construction and closing were still ahead.
The same table also breaks down the homes still for sale by stage, which is why the inventory figure includes houses that have not been built yet. The months' supply section below picks up that thread.
A new-home sale can happen before, during or after construction
September 2026 sales by stage at time of sale (SAAR)
Sale stage ≠ completion stage. Source: U.S. Census Bureau and HUD, New Residential Sales, September 2026.
What Does 8.4 Months of Supply Mean?
Census defines months' supply as the ratio of houses for sale to houses sold. Conceptually:
new homes for sale ÷ current sales pace (on a monthly basis) = months' supply
Census describes the result as how long the current for-sale inventory would last at the current sales rate if no additional new houses were built. In September 2026, 476,000 new homes for sale against a 676,000 annual sales rate produced a months' supply of 8.4.
What it does not prove on its own
A months' supply figure does not, by itself, establish:
- that the market favors buyers;
- that there is an oversupply of housing;
- that prices will fall;
- that demand is weak;
- how long any individual house will take to sell.
Why it needs context
- It moves with both parts of the ratio. Months' supply can rise because inventory grew, because the sales pace slowed, or both. A one-month change can also reflect the uncertainty in the sales estimate: September's months' supply change from August came with a wide confidence interval.
- Not all inventory is finished. Census counts homes for sale at every stage. For September 2026, the seasonally adjusted 476,000 included about 115,000 homes not yet started, 250,000 under construction and 111,000 completed.
- It covers new homes only. This is new-home inventory, not all housing inventory. Existing-home inventory and months' supply are measured separately by NAR and other sources, using their own definitions, and should not be treated as interchangeable with Census's figure.
Why the Median New-Home Price Can Move Even When Identical-Home Prices Do Not
The September 2026 report showed a median sales price of $400,400 and an average sales price of $472,800. An average above the median typically means that a smaller number of higher-priced sales are pulling the average up more than they move the middle value.
A median of sales is not a price index
The median is the middle price of the new homes that sold in the month. If the mix of homes sold changes, the median can change even if prices for comparable houses do not. Census says so directly: changes in sales price data reflect changes in the distribution of houses by region, size and other characteristics, as well as changes in the prices of houses with identical characteristics.
The monthly price changes were not significant either
Census reported September's median as a 3.9% higher point estimate than August's $385,400, with a 90% confidence interval of ±6.2%, and a 3.9% lower point estimate than September 2025's $416,800, with an interval of ±8.9%. Both intervals include zero, so neither change was statistically significant.
Different price measures, different questions
A repeat-sales index such as the FHFA House Price Index is designed to track price changes for the same properties over time, which reduces the effect of a changing sales mix. A median of new-home transaction prices answers a different question: what was the middle price of the new homes that sold this month? Neither replaces the other.
The median new-home price also says nothing by itself about whether homes are affordable for a typical household, which depends on income and mortgage rates as well as price. See Housing Affordability Explained for how those pieces fit together.
What New Home Sales Can and Cannot Tell You
Can help describe
- sales pace
- new-home inventory
- months’ supply
- construction stage
- median/average transaction prices
- regional activity
- comparisons across periods
Cannot establish by itself
- total housing demand
- housing shortage
- oversupply
- future prices
- affordability
- buyer sentiment
- future mortgage rates
- investment returns
- whether a metro is good or bad
Source facts: Census/HUD. Interpretation: Metro Analytics.
Each of those questions needs other data. The report measures contract activity for one segment of the market, and conclusions drawn from it should stay inside that boundary.
How Investors and Analysts Should Read New Home Sales
New Home Sales should be treated as one housing-market signal, not as an investment signal by itself. It describes contract activity for newly built single-family homes. It does not, alone, describe the economics of any property, market or investment.
The report is most useful read alongside other indicators, such as:
- building permits, housing starts and completions, which describe construction activity;
- existing-home inventory, measured separately from new-home inventory;
- pending and existing-home sales, which describe contracts and closings for previously owned homes;
- mortgage conditions and affordability;
- employment and income;
- household growth and migration;
- local market fundamentals, which national figures cannot capture.
National and regional new-home sales figures also say little about any individual metro. Local conditions are better read from local data. See Metro Analytics markets for local context. Related housing indicators are collected on the Indicators page.
Metro's approach is to rely on primary sources, show the methodology behind each figure and keep conclusions within what the evidence supports. See the Methodology for how each measure is defined and sourced. This article makes no trading recommendation and no forecast.
The Takeaway
New Home Sales is a useful measure of contract activity for newly built single-family homes, but reading it correctly takes more than the headline.
- A sale is a contract, not a closing. Census records a sale when a contract is signed or a deposit is accepted, which can happen before a permit, before construction starts and well before closing.
- 676,000 is a pace, not a count. It is September's seasonally adjusted pace multiplied by 12, and Census says it is neither a forecast nor a projection.
- Check significance and wait for a trend. September's -0.6% monthly and -5.3% yearly changes were not statistically significant, and Census says it takes four months to establish a trend.
- Expect revisions. Preliminary totals are revised by about 6.7% on average.
- Keep the comparisons straight. Pending home sales are contracts on existing homes, existing-home sales are closings, and housing starts are construction beginning.
Read carefully, the new home sales report shows what one segment of the market has been doing and how confident you can be about it. It does not say whether the housing market is good or bad.
Sources
- Census Bureau / HUD — Monthly New Residential Sales, September 2026
- Census Bureau — New Residential Sales
- Census Bureau — Survey of Construction: Definitions
- Metro Analytics — Methodology
Editorial analysis for informational purposes only. Not investment, legal, or financial advice.